
Facebook is a goldmine for businesses, with over 2.9 billion daily users, it’s the ultimate platform for building brand awareness, connecting with potential customers, and driving sales. A great way to expand your reach is through Facebook Ads. But how do you know if the ads are doing their job? Here’s all the intel you need to assess your performance and strategize for 2024 – Unveiling the Facebook Ads Benchmarks 2024.
The data we’ve shared covers popular campaign objectives like lead generation and website traffic for a variety of business categories. So, what are the key metrics you will need to focus on?
- Click-through rate (CTR): Are your ads grabbing enough attention?
- Cost per click (CPC): Is your budget stretching far enough?
- Conversion rate: Are viewers becoming customers?
- Cost per action: Are you getting the most bang for your advertising buck?
The data from Facebook Ads Benchmarks 2024 will allow you to see how your campaigns stack up against the competition so that you can identify areas for improvement.
Facebook Ads Benchmarks 2024 for Traffic:
As per reports, 54.9% of Facebook users research brands on the platform and 66% explore local business pages weekly. The platform continues to be an effective way to reach and connect with your ideal customers. And selecting the right ad format is key to unlocking its potential. You have a variety of formats to choose from:
- Photos: Simple but powerful, just an image with a catchy caption can grab the attention.
- Videos: Tell your brand story, showcase products, or offer tutorials.
- Carousels: Unfold your narrative across multiple images or videos, keeping viewers engaged.
- Stories: Capture attention with fleeting visuals to build urgency.
- Messenger Ads: Go private! Engage customers directly with personalized offers and support.
- Product Collections: Turn your feed into a shop window, showcasing your catalog.
- Interactive Games: Boost brand recall and build community with engaging experiences.
To amplify your ad’s impact, align your format with your message. Moreover, offering content that will resonate with your audience is imperative. In the end, you need to use the data to see what works and what doesn’t so that you optimize your campaign strategy accordingly. This is why you need to track key metrics.
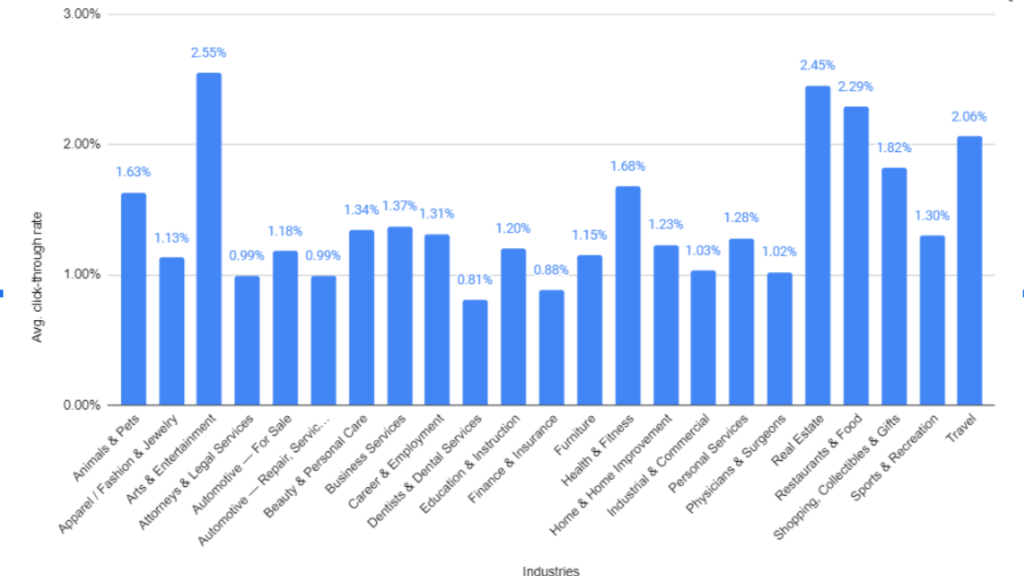
The Average Facebook Ad CTR for Traffic Campaigns is 1.51%
Click-through rate (CTR) is a key metric in advertising, reflecting the percentage of ad impressions that result in clicks. It measures the ad’s ability to capture the audience’s attention and encourage engagement. Here’s how you can calculate CTR:
Number of Clicks / Number of Impressions x 100 = CTR (%)
Industries that fare well in this case:
- Arts & Entertainment: Showcasing fun and excitement resonates well with viewers with a CTR of 2.55%!
- Real Estate: Location, location, location! Eye-catching visuals of dream homes lead to a CTR of 2.45%.
- Restaurants & Food: With delicious imagery this industry attracts clicks with a 2.29% CTR.
On the other end, some industries face tougher competition for attention:
- Dentists & Dental Services: A trip to the dentist might not be everyone’s idea of a good time, leading to a lower CTR of 0.81%.
- Finance & Insurance: Complex subjects require clear communication, resulting in a 0.88% CTR.
- Attorneys & Legal Services: Building trust takes time, reflected in a CTR of 0.99%.
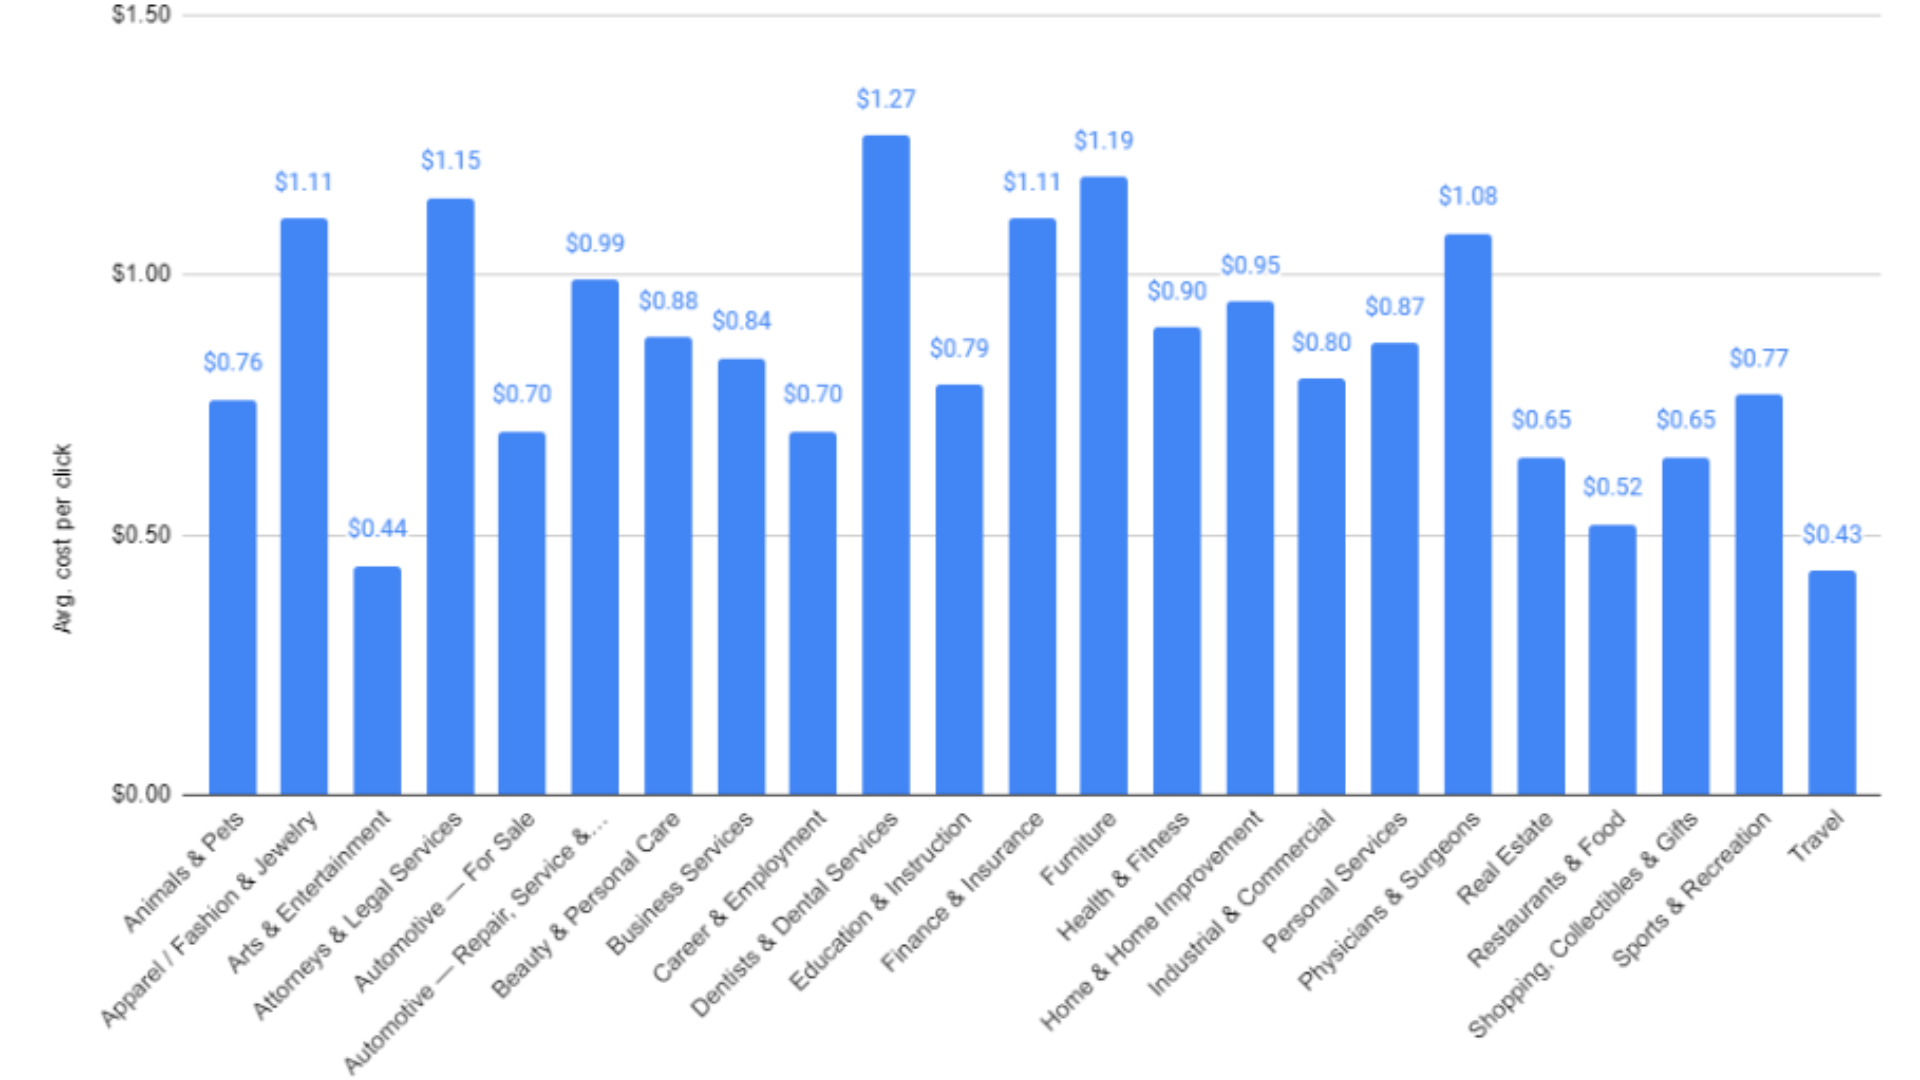
Cost Efficiency: How Different Industries Pay for Facebook Clicks?
Wondering how much bang you’re getting for your buck with Facebook Ads? We’ve got the industry scoop on the average cost per click (CPC) for traffic campaigns! Here’s how you can calculate CPC:
Total Ad Spend ÷ Number of Ad Clicks = Cost per Click
Across the board, the average CPC for Facebook traffic ads sits at $0.83. That’s significantly lower than the average Google Ads CPC of $3 to $4.22! But within specific industries, there’s a wide range of click costs.
Travel, Arts & Entertainment, and Restaurants take the crown for budget-friendly clicks, averaging between $0.43 and $0.52 per click. People are actively seeking fun and indulgence in these areas, making them more receptive to ads and driving down costs.
But, industries like Dentists & Dental Services, Furniture, and Attorneys & Legal Services experience slightly higher CPCs, ranging from $1.15 to $1.27. Building trust and understanding complex topics takes more effort, translating to higher ad costs. However, a high CPC doesn’t necessarily mean inefficiency. These industries often boast higher customer lifetime value, justifying the increased advertising expense.
Facebook Ads Benchmarks 2024 for Lead Generation:
Want to turn Facebook clicks into valuable leads? Dive into these industry-specific benchmarks for lead-generation campaigns.
Click Magnet Industries:
- Travel: Intriguing destinations reel people with a 6.62% CTR.
- Arts & Entertainment: Fun and excitement are irresistible lures for clicks (3.70%).
- Real Estate: Eye-catching homes snag a 3.69% CTR, turning window shoppers into potential buyers.
Click Challengers:
- Automotive – Repair, Service & Parts: Fixing cars takes more effort than generating clicks (1.38%). Clear communication and targeted ads are key.
- Industrial & Commercial: Not everyone’s cup of tea, but still a decent 1.50% CTR. Precise audience targeting is crucial.
- Health & Fitness: Wellness journeys need compelling visuals to boost their 1.66% CTR.
Cost-Conscious Champions: Industries with the Lowest CPC
- Arts & Entertainment: Lead the way in affordability with a $0.87 CPC!
- Travel: Explore without emptying your wallet with a $0.96 CPC.
- Sports & Recreation: Boasts an impressive $1.11 cost per click.
Costly Clicks, High Rewards:
- Attorneys & Legal Services: Building trust comes at a price with a $5.42 CPC. But those leads can be incredibly valuable.
- Dentists & Dental Services: Conquering smile insecurities isn’t cheap, reflected in a $3.82 CPC. However, the potential customer lifetime value is high.
- Physicians & Surgeons: Health is priceless, and so are these $3.63 CPC leads. High costs often translate to high customer value.
Facebook Ads Benchmarks 2024 for Conversions:
You have to track your Facebook Ads conversion rate because just clicks aren’t enough. While clicks get you the traction, true ad success lies in what happens next. Here’s how you can calculate your Facebook Ads conversion rate:
Number of Ad Conversions / Number of Ad Clicks x 100 = Conversion Rate (%)
Industry Winners in Conversion:
- Dentists & Dental Services report 11.34% conversion rate
- Industrial & Commercial: Precision targeting pays off with a 10.13% conversion rate.
- Arts & Entertainment reports 9.77% conversion rate.
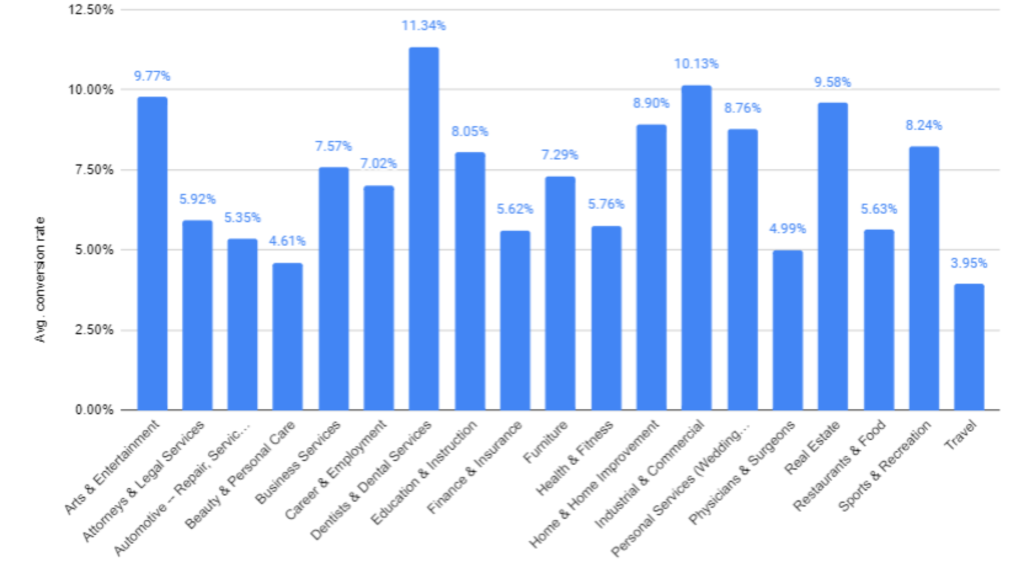
Conversion Challengers:
- Travel reports a 3.95% conversion rate suggesting room for improvement.
- Beauty & Personal Care: Enhancing looks needs enticing visuals to boost its 4.61% conversion rate.
- Physicians & Surgeons: Building trust in healthcare takes time, reflected in a 4.99% conversion rate. Patience and strong branding are essential.
How to Boost Traffic Using Facebook Ads?
- Targeted Approach: Utilize the “traffic objective” and leverage Facebook’s powerful algorithms to attract highly engaged viewers, driving significant website visits.
- Compelling CTAs: Craft persuasive calls to action that entice users to click – think “Explore Now” or “Download the Comprehensive Guide.” A/B testing different options is crucial for identifying what resonates best.
- Visual Captivation: Do not use generic imagery, instead go for captivating visuals. Eye-catching photos and videos have the power to arrest attention and spark clicks.
How to Drive Leads with Facebook Ads?
- Incentivize your audience: Move beyond generic forms and offer exclusive value propositions. Consider limited-time discounts, downloadable resources, or early access to new products.
- Streamlined forms: Create a frictionless experience for lead acquisition. Optimize form layouts, minimize unnecessary fields, and prioritize user-friendliness.
- Transparency builds trust: Be upfront about the action users take by clicking. Inform them they’re entering a lead generation funnel, fostering trust and encouraging conversion.
Top Tips to Improve Your Facebook Ads CTR:
- Metrics that matter: While CTR is important, consider the holistic picture. Analyze cost per thousand impressions (CPM) and cost per click (CPC) to identify cost-optimization opportunities.
- Emotionally charged copy: Unleash the power of word choice. Utilize words that evoke curiosity, excitement, and discovery – “unleash,” “transform,” and “uncover” can be powerful click magnets.
- Data-driven insights: Employ analytics dashboards to track key performance indicators. Discover which ads resonate, and which audiences convert, and continuously fine-tune your strategy for maximum impact.
3 Strategies to Reduce Your Facebook Ads Cost:
- Precise targeting: While a broader audience reach can reduce CPM, for lead generation, prioritize laser-focused targeting of demographics most likely to convert. This optimizes ROI and delivers higher-quality leads.
- Smart scheduling: Don’t pay for 24/7 visibility if your audience isn’t active then. Schedule your ads strategically for peak times when they’re online and engaged.
- Objective alignment: Treat Facebook objectives like Google Ads goals. Choose the one that aligns with your ultimate aim, whether it’s lead generation, brand awareness, or driving sales. The right objective ensures your campaign is optimized for achieving your specific goals.
Quick Ways to Increase Conversion Rate:
- Ensure your Facebook pixel is meticulously configured for accurate conversion tracking. This ensures every lead is captured, providing valuable insights for optimizing your campaigns.
- Craft a landing page that seamlessly extends the ad’s narrative and guides users towards conversion. Prioritize clear CTAs, relevant visuals, and a user-friendly experience.
- Facebook ads are a powerful tool, but don’t neglect broader marketing strategies. Share organic posts, explore other social media platforms, and consider SEO and search advertising. A cohesive multi-channel approach amplifies your reach and maximizes conversions.
Takeaway!
While the information from Facebook Ads Benchmarks 2024 can help, navigating the ever-evolving landscape is daunting. If you’re struggling to conquer rising CTRs, CPCs, and CPAs despite your best efforts, consider this: sometimes, the smartest move is to enlist the expertise of a seasoned digital marketing agency.
At Growth Marketing Genie, we’ve cracked the Facebook Ads code so that your campaign is not limited to clicks but is also focused on conversions. So, let’s unlock your conversion potential together and dominate the social media platform in an effective way.
Book in a Free Consultation